3D / Three.js
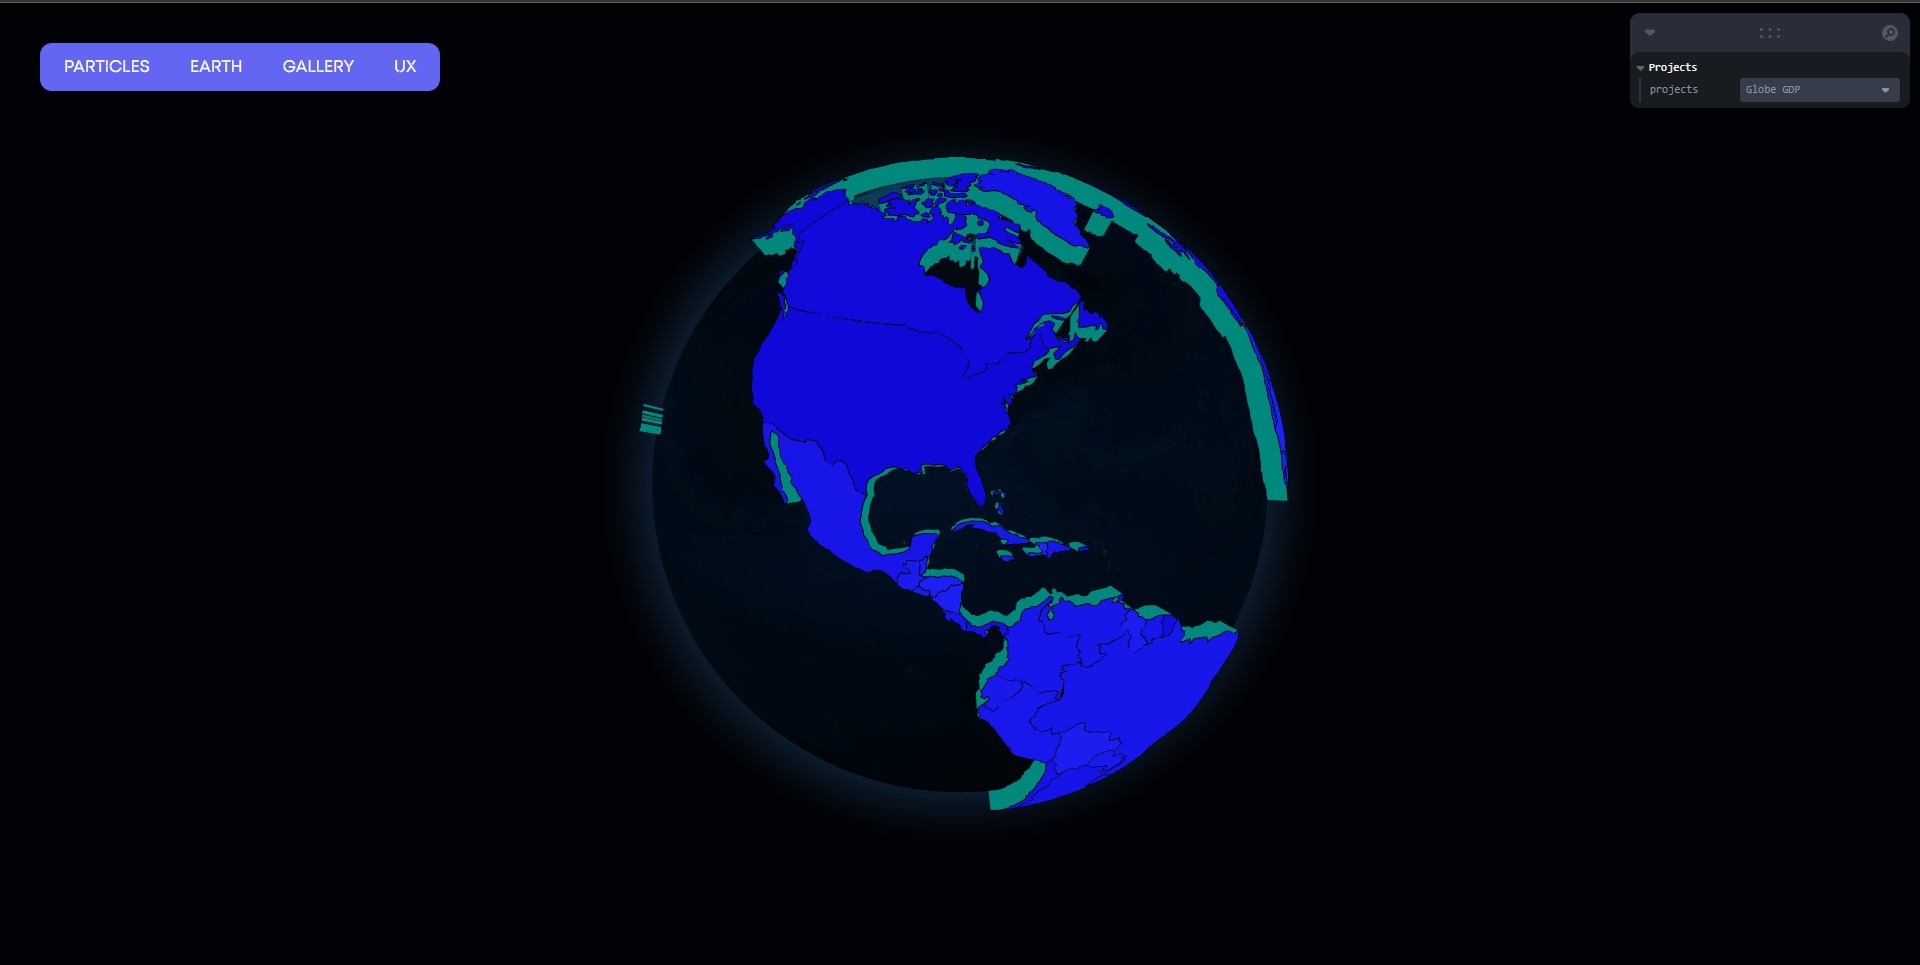
3D Data Visualization — GDP on an Interactive Globe
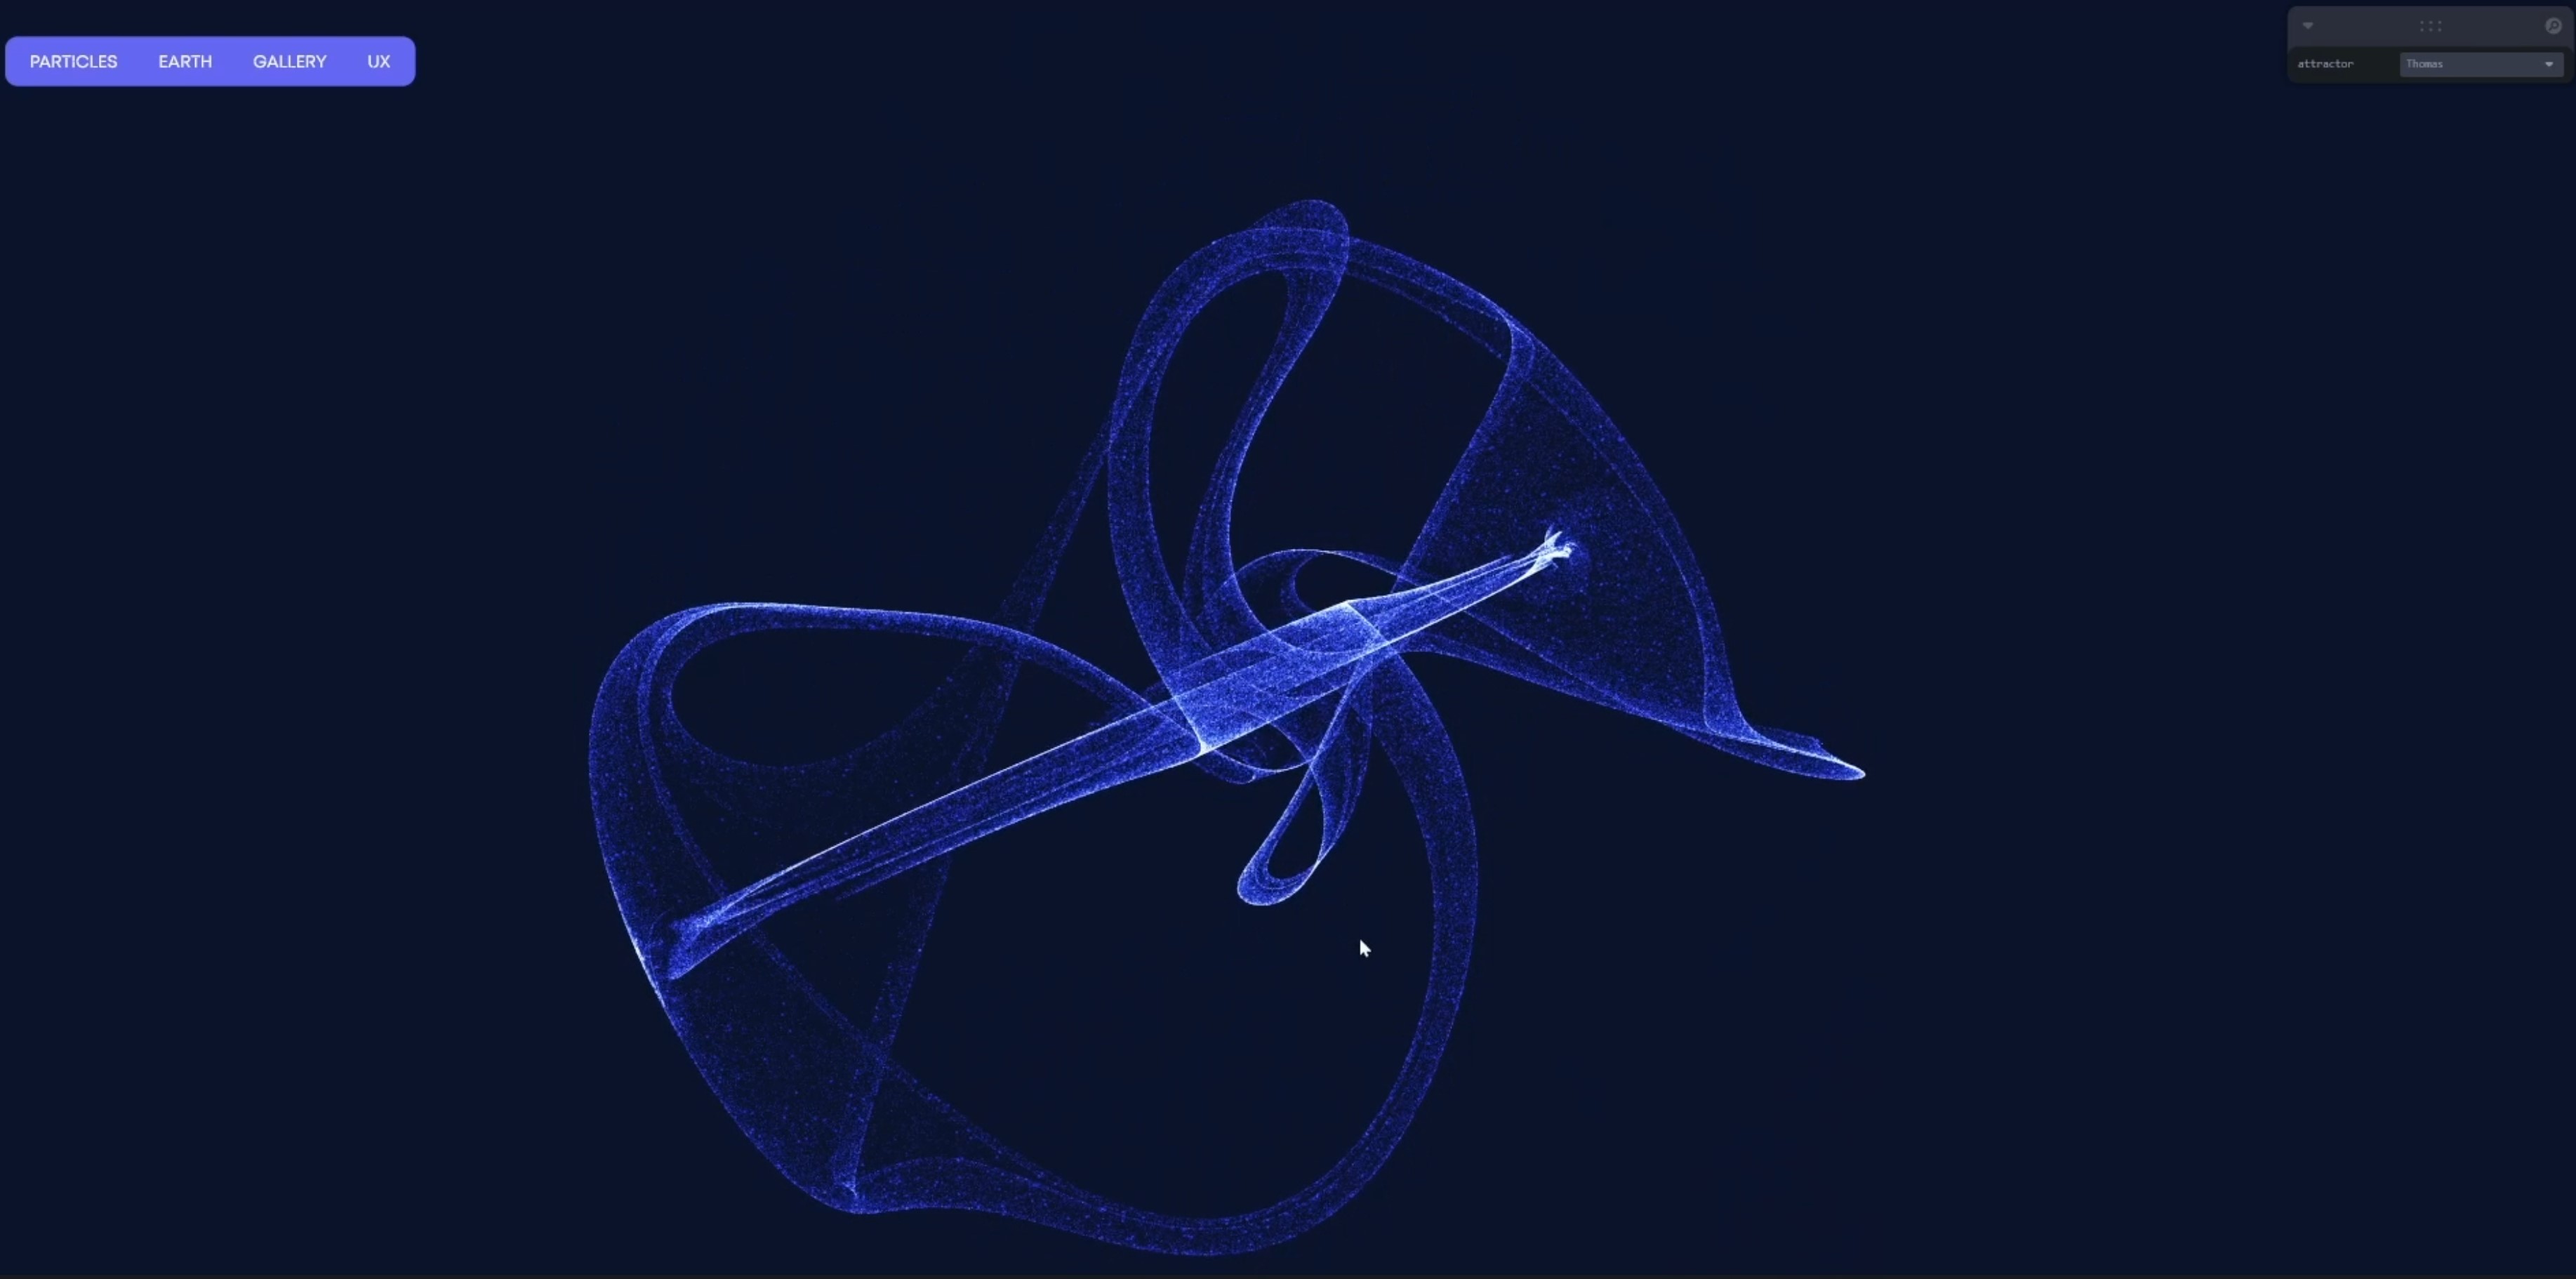
An interactive Three.js globe rendering world GDP data in 3D, plus a GPU particle simulation — live demos of what WebGL can do for storytelling.
The challenge
Flat charts make global datasets forgettable. The goal: render real GDP data on an explorable 3D globe that runs smoothly in the browser — and push further with GPU-computed particle simulations.
The solution
A React Three Fiber globe with custom GLSL shaders for the atmosphere and data extrusion, tuned for smooth interaction. A companion FBO particle simulation moves hundreds of thousands of particles entirely on the GPU.
Results
Real-world dataset rendered as an explorable 3D scene
60fps
GPU-driven particle simulation in the browser